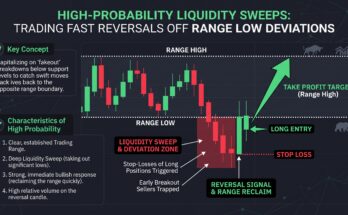
You have likely experienced the frustration of a “perfect” trade setup that suddenly implodes, leaving you liquidated while the market reverses in the opposite direction. We have all been there. Most retail traders focus exclusively on chart patterns and candle formations, ignoring the mechanical engine driving the price: the derivatives market. In crypto, the spot price is often just the shadow cast by the leverage-heavy perpetual futures market.
If you want to trade with professional-grade clarity, you must stop viewing price in a vacuum. You need to identify when the market’s “leverage engine” is overheating. When Open Interest (OI) builds up alongside extreme, overcrowded funding rates, the market isn’t just trending—it is becoming a pressurized trap waiting to spring.
The Mechanics of a Leverage Flush
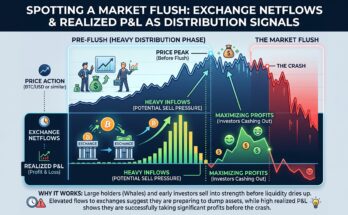
At its core, a leverage flush is a massive, forced unwinding of positions. Think of it as a house of cards: when too many traders are leveraged in the same direction, even a minor price move against them forces liquidations. These liquidations trigger further price moves, creating a cascade that wipes out everyone with thin margins.
Expert Insight: I monitor the “Funding-OI” correlation to identify these zones. When you see Open Interest climbing steadily alongside an aggressively positive funding rate, you are witnessing the “long-crowding” phenomenon. Every new buyer is essentially adding fuel to a fire that needs a reason to burn out. If the price fails to sustain a new high under these conditions, the probability of a “long squeeze” flush rises exponentially.
Identifying Overcrowded Funding Rates
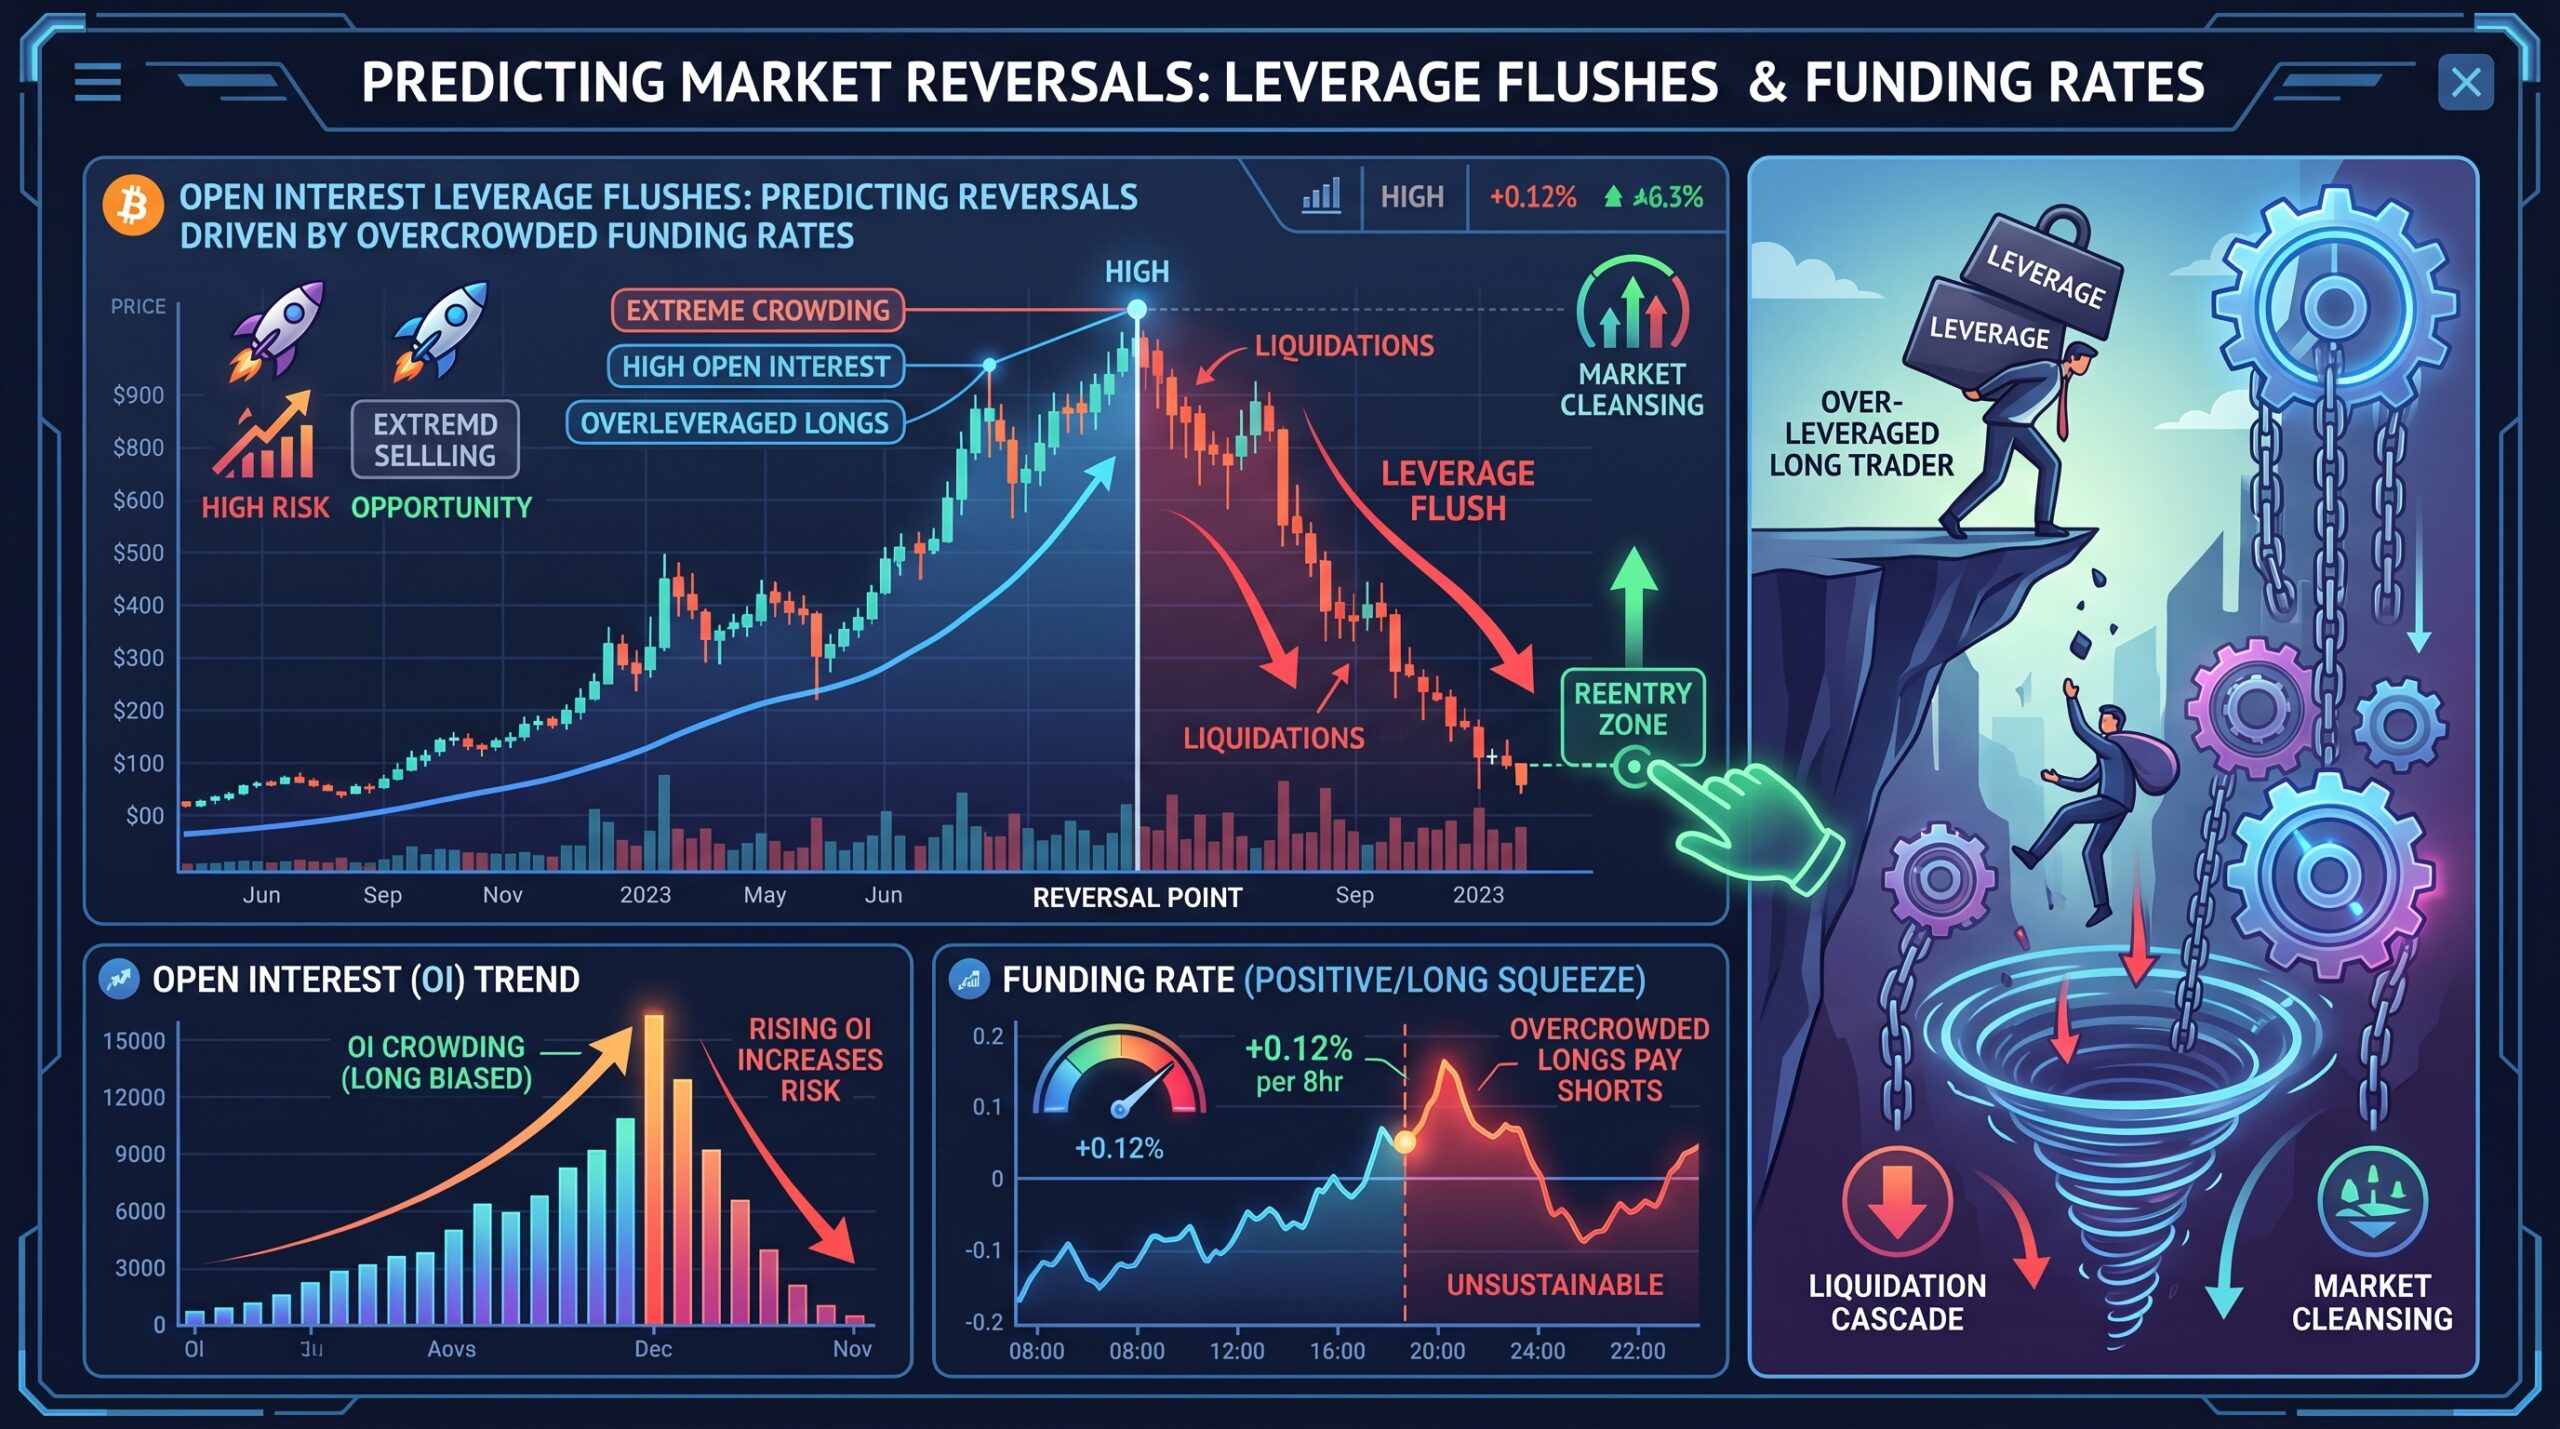
Funding rates are the “interest” paid between traders to keep futures prices tethered to spot prices. Under normal conditions, they are small and rhythmic. However, when rates become “overcrowded”—meaning they stretch to extreme positive or negative values—they signal a dangerous consensus.
-
Extreme Positive Funding: Longs are paying a premium to hold their positions, signaling an over-bullish, leverage-heavy market. This is the prime environment for a violent downward flush.
-
Deep Negative Funding: Shorts are paying to stay in their positions, signaling massive bearish desperation. This often sets the stage for a “short squeeze” where the market aggressively rips upward, forcing shorts to cover at any price.
Decoding the Signal: The 2-of-3 Rule
Never rely on a single metric. To spot an impending leverage flush, I look for three specific conditions that create a “max pain” environment:
-
Extreme Funding: The rate is at a multi-week high or low.
-
Rising Open Interest: This confirms that fresh capital and fresh leverage are still pouring into the crowded trade.
-
Price Stagnation: The price hits a resistance or support level and refuses to break through despite the high leverage.
Personal Example: I remember a Bitcoin setup in early 2026 where the funding rate hit a record peak, yet the price stalled for 48 hours. The Open Interest was still climbing, meaning late-stage speculators were piling in while the “smart money” was already distributing. I exited my long and waited. When the flush hit, it took out 10% of the price in minutes. The market structure didn’t lie; the funding data was screaming that a correction was inevitable.
Managing Risk During Leverage Extremes
When the metrics show an overcrowded market, your primary goal is survival. Don’t fight the crowd to get the “last drop” of profit. Instead, tighten your stop-losses or move to the sidelines.
-
Avoid Chasing Breakouts: If funding is already extreme, a breakout attempt is likely to fail or lead to a “fake-out” before the real move occurs.
-
The Squeeze Target: If you are nimble, you can play the reversal by looking for a high-volume wick that clears the liquidation levels. These wicks often mark the local top or bottom of the cycle.
-
Data-Driven Patience: Sometimes, the best trade is the one you don’t take. If the OI and funding metrics are showing a massive imbalance, wait for the flush to complete before re-entering the trend.

A leverage flush is not a random act of market chaos; it is a predictable reaction to a system that has become too one-sided. By integrating Open Interest and funding rate analysis into your daily routine, you stop being the “liquidity” for institutional traders and start identifying where the “maximum pain” will occur. Don’t trade the noise; trade the pressure. Keep your eyes on the funding rates, stay disciplined, and you will find yourself on the right side of the next major market reversal.
FAQ
Where can I find real-time funding rate data?
Platforms like TradingView, Glassnode, or Coinglass provide real-time dashboards for funding rates and aggregated Open Interest across all major exchanges.
Is high Open Interest always bad?
No, it simply indicates higher market participation. It only becomes “bad” when combined with extreme, one-sided funding rates that suggest the market is leaning too heavily in one direction.
How do I know if the funding rate is “extreme”?
Compare the current rate to the 30-day average. If it is 3x or 4x higher than the typical daily variance, consider it a signal of potential overcrowding.
Can I use this strategy on altcoins?
Yes, but proceed with caution. Altcoins often have significantly lower liquidity and higher volatility, meaning the “flush” can be much more severe and harder to time than with Bitcoin or Ethereum.