You have likely stared at a cluttered, neon-colored chart, trying to make sense of conflicting signals while the crypto market moves against you. We have all been there. Most traders treat their charting software like a junk drawer, tossing every popular indicator onto the screen until the price action itself is buried under noise. If you want to trade crypto like a professional, you must treat your TradingView workspace as a precision instrument, not a digital gallery.
Configuring your workspace is the foundational step in professional risk management. By designing custom indicator suites and optimized chart profiles, you create a system that filters out the noise and highlights the data that actually moves your portfolio. Let’s break down how to architect your TradingView environment for maximum clarity and execution speed.
Mastering the Indicator Suite: Quality Over Quantity
The biggest trap for new traders is “indicator stacking.” You don’t need twenty overlapping momentum oscillators to tell you the market is trending. You need a streamlined suite that covers three essential bases: trend direction, momentum, and volume-based liquidity.
Expert Insight: I suggest picking 3–5 indicators that offer distinct perspectives. For instance, combine an EMA Ribbon (for trend direction), the Relative Strength Index (RSI) (for momentum), and the Volume Profile Visible Range (VPVR) (for locating structural support and resistance). If you find yourself constantly adding new indicators to “confirm” a bad trade, you aren’t fixing your analysis; you’re just adding noise.
-
Configuring Display Settings: Use the gear icon on each indicator to customize its visuals. Set your primary trend lines to a distinct color, like blue or white, and keep secondary signals in muted tones.
-
Layering for Clarity: Use separate panes for oscillators like the RSI or MACD so they don’t overlap with your price action. This keeps your main chart clear for drawing trend lines and chart patterns.
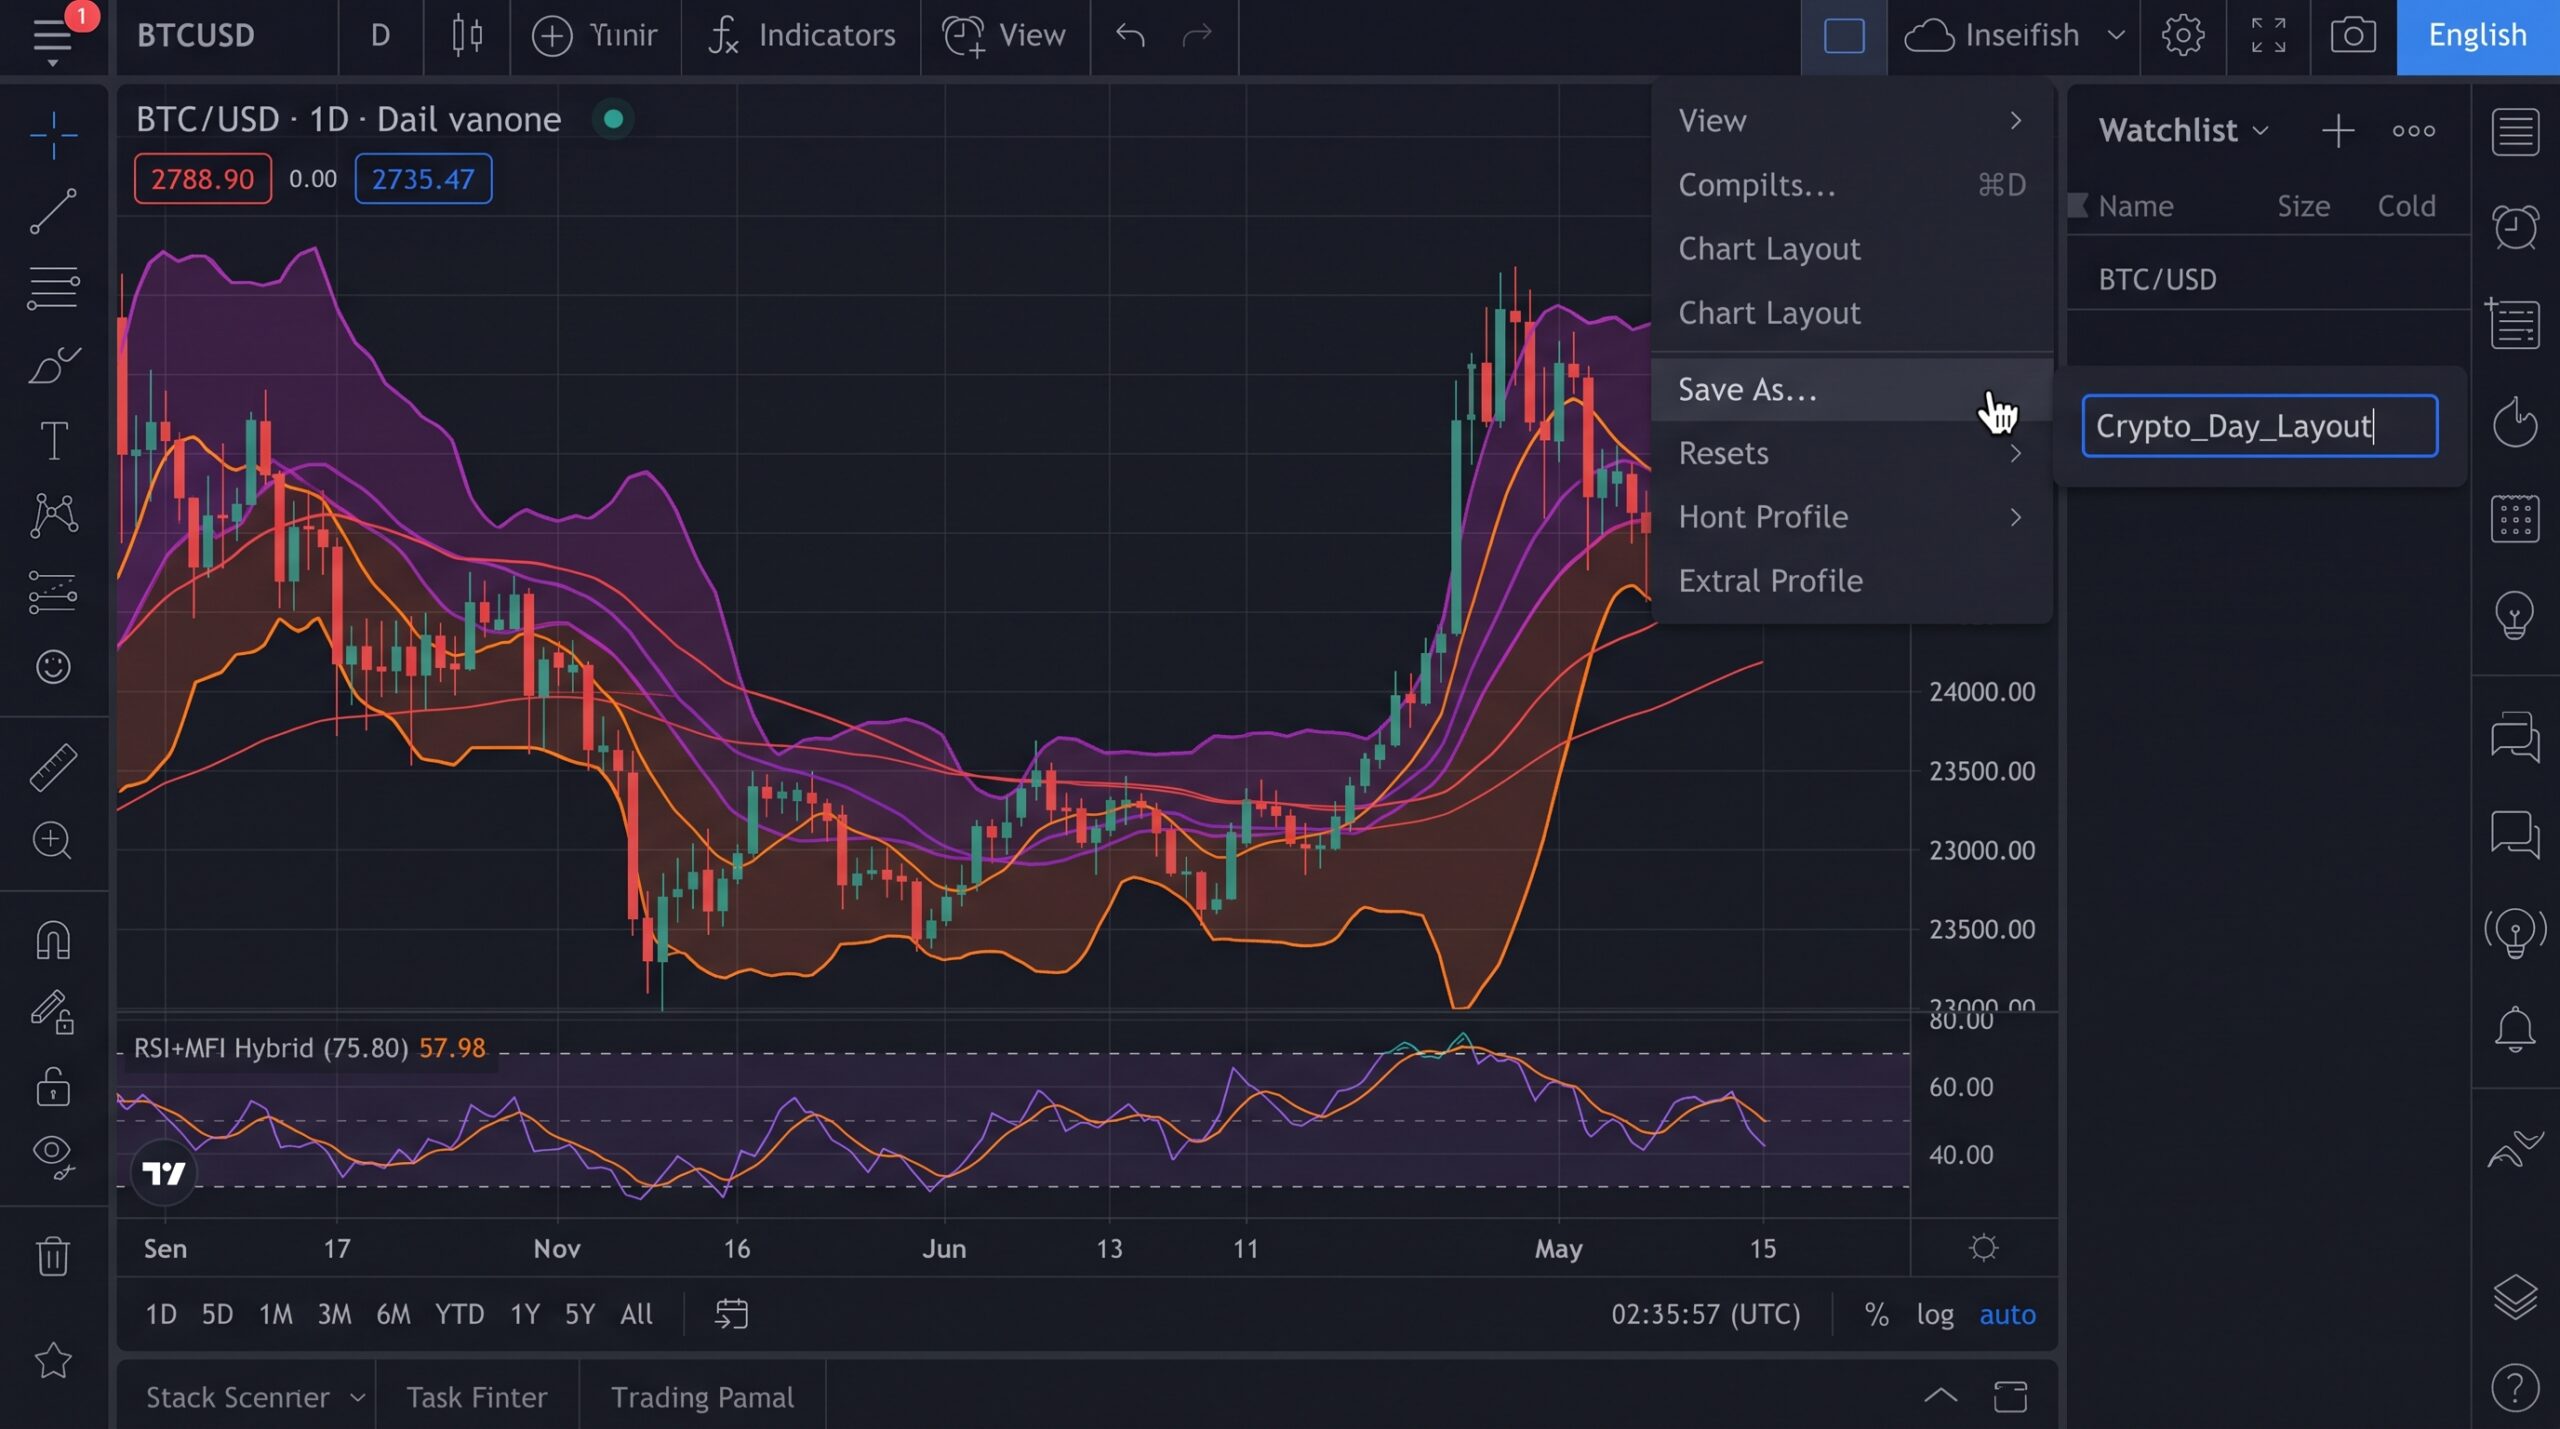
Architecting Chart Profiles and Layouts
A layout in TradingView is more than just a skin; it is a dedicated workspace. Because crypto markets often require simultaneous monitoring of a base asset (like BTC/USDT) and correlated altcoins, you should use the “Layout” feature to save specific setups.
Personal Example: I maintain two distinct profiles: one for “Macro Analysis” and one for “Execution.” My Macro profile includes high-timeframe charts and fundamental overlays, while my Execution profile is stripped down to just the price, volume, and my favorite pivot-point indicators. By switching between them with a single click, I prevent myself from over-analyzing minor 5-minute fluctuations when I should be looking at the daily trend.
-
Synchronization: Remember to synchronize your drawing tools across layouts if you want your trend lines to remain consistent, or disable it if you prefer “clean” charts for different timeframes.
-
Templates: Save your indicator set as a “Template.” This allows you to apply your entire configuration to any new pair in seconds without manually re-adding every study.
Advanced Alerting: Your System’s “Eyes”
You cannot watch every crypto pair at once, nor should you. Professional traders use TradingView’s alert system to “set and forget” their interest zones. By right-clicking on specific trend lines or price levels, you can set alerts that trigger only when your specific criteria are met.
Expert Insight: Avoid “Price-only” alerts. Instead, use “Indicator-based” alerts that combine conditions. For example, set an alert for when price breaks a major resistance and the RSI crosses above 60. This multi-factor approach eliminates most “fake-out” alerts and ensures you only look at the chart when a high-probability setup is actually forming.
Optimizing for Execution Speed
If you are actively trading, you need to minimize the friction between your analysis and your order entry. TradingView allows you to link your exchange account directly to the platform. By utilizing the “Chart Trading” panel, you can drag and drop your take-profit and stop-loss lines directly on the chart.
-
Visual Order Management: Instead of typing numbers into a box, visually adjust your risk-reward ratio by moving the lines on your chart.
-
The Audit Hub: Keep your workspace hub visible at the bottom of the screen to monitor your margin usage and active positions. This keeps your account health front-and-center, preventing you from accidentally over-leveraging during volatile crypto swings.
Your chart is your cockpit. If it’s messy, your decision-making will be messy. By narrowing down your indicators to a purposeful set, using saved layouts to switch between timeframes, and leveraging advanced alerts, you transform your trading process from reactive to systematic. Take the time to clear the clutter, define your strategy, and build a workspace that works for you, not against you.
FAQ
How many indicators are too many?
If you can’t see the candles clearly, you have too many. Stick to 3–5 indicators that each serve a unique, non-overlapping purpose.
Should I use free or paid TradingView?
If you rely on multiple indicators or need to track many watchlists, the paid tiers are worth it for the increased limits on indicators per chart and layout saving features.
How do I save my current setup?
Click the “Template” button in your indicator menu and select “Save Indicator Template.” You can then load this template onto any chart in the future.
Can I trade directly on the chart?
Yes, by connecting a supported exchange to your TradingView account. This allows you to place limit and market orders without ever leaving your charting screen.