You have likely watched the price of your favorite crypto asset break below a clear support level, only to see it immediately snap back upward with aggressive intent. You were stopped out, liquidated, or simply watched from the sidelines in frustration, convinced that the “support” was broken. We have all been there. Most traders interpret these moves as structural breakdowns, but the pros see them for what they really are: high-probability liquidity sweeps designed to trigger stop-losses and fuel a sharp reversal.
If you are trading based on “support and resistance” lines drawn on a chart, you are essentially providing the fuel for the very market makers you are trying to outsmart. A liquidity sweep—or a “deviation”—is the market’s way of hunting for the stop-losses that sit just below the range lows. Once those orders are filled, the institutional “smart money” has the liquidity they need to reverse the trend. Let’s demystify how to identify these traps and turn them into your highest-conviction trade setups.
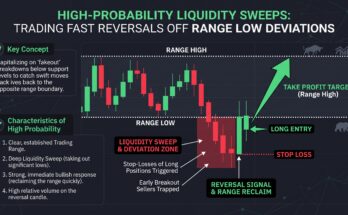
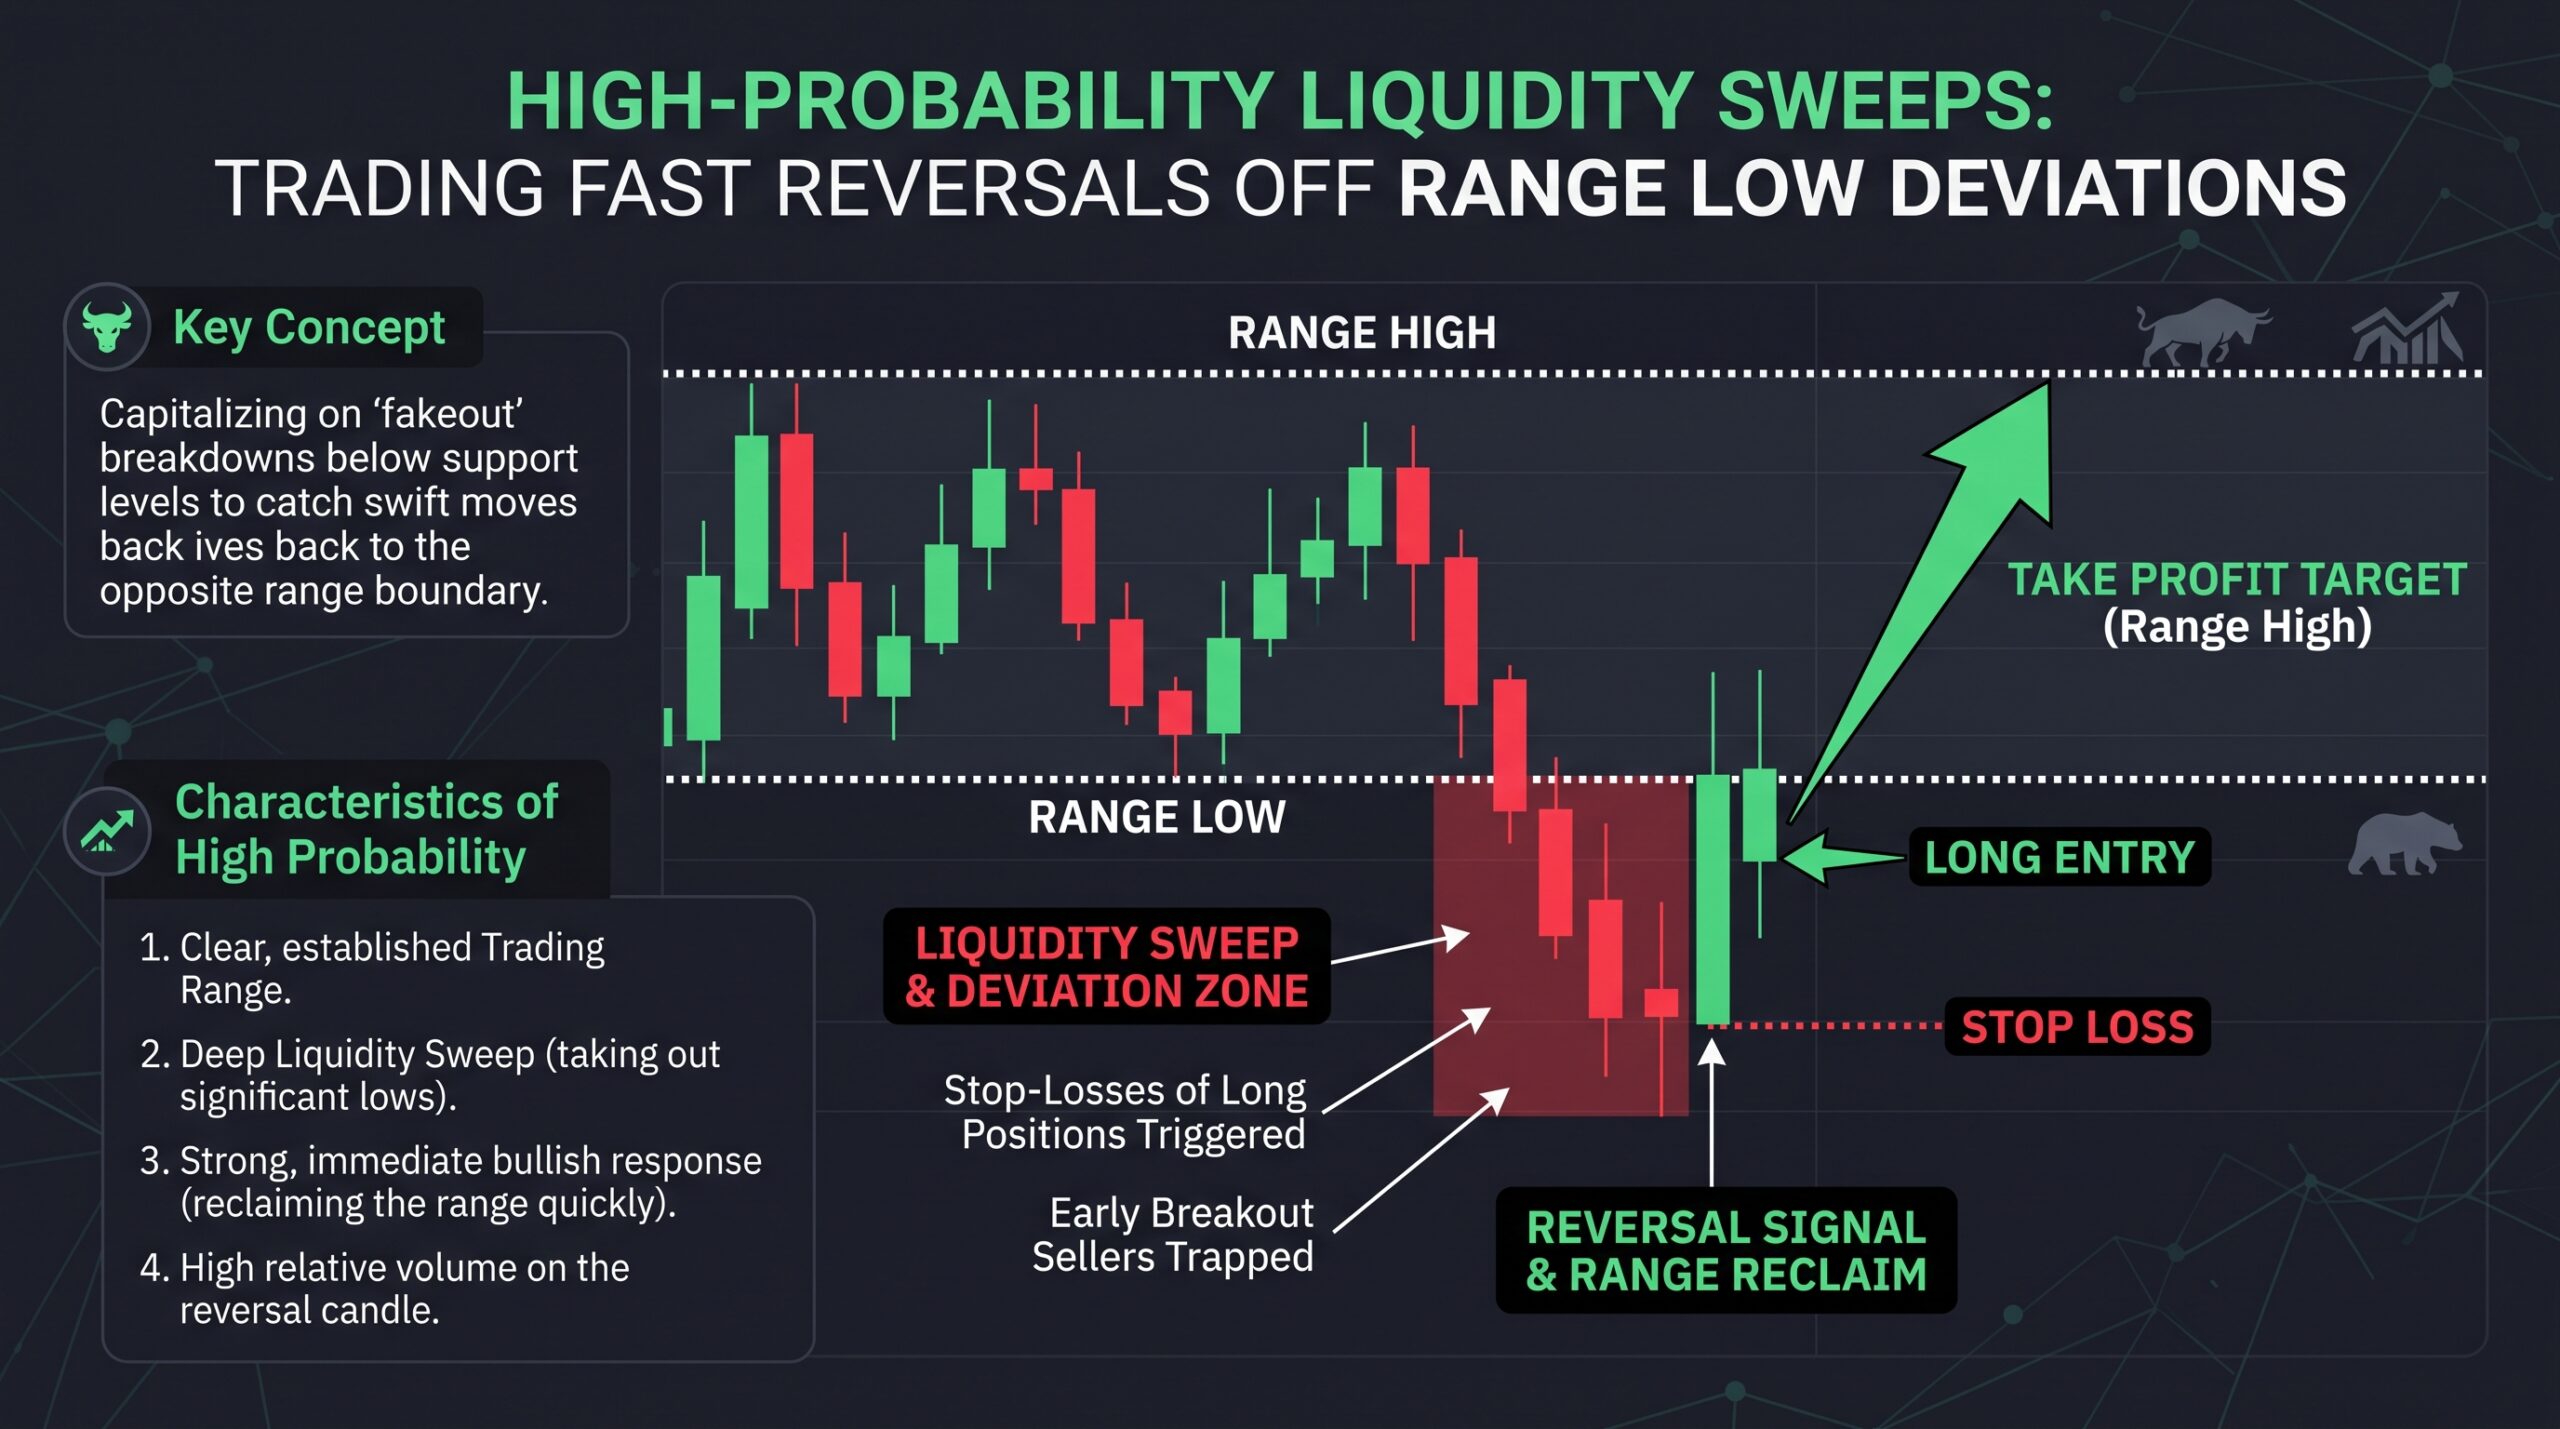
The Anatomy of a Deviation
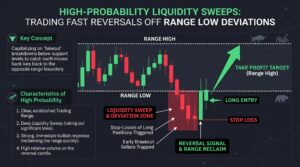
A range deviation occurs when price briefly dips below an established support zone, triggering a wave of sell-stop orders. This is the “sweep.” Retail traders see the break and pile into short positions, expecting further downside. Meanwhile, institutional algorithms use this burst of sell-side liquidity to fill their own massive buy orders at a discounted price.
Expert Insight: A true liquidity sweep is rarely a clean break. Look for a “wick” that slices through the range low and closes back inside the range within a short timeframe. If the candle closes well below the range, that is a breakdown; if it snaps back, that is a deviation. The faster the reversal, the more confident I am in the institutional intent behind the move.
Why Institutional Algorithms Need Your Stops
Institutions cannot move millions of dollars in capital without causing massive slippage. They need a “counter-party” to fill their massive positions. By pushing the price slightly below the range low, they force retail traders to sell into their bids. Your stop-loss is not just a risk management tool; it is the liquidity they need to get “long” at the best possible price.
Personal Example: I used to view range breaks as an immediate signal to jump on the trend. I would short the break of support, only to be stopped out by a massive spike ten minutes later. Now, I explicitly wait for the “sweep.” When the price dips below the range low, I don’t touch it. I wait for the recapture of that level, which signals that the sweep is complete and the “reversal” has begun.
Confirming the Reversal: The “Recapture” Protocol
The most critical part of this strategy is the “recapture” of the range. You never want to catch a falling knife while the price is still below the support line. Instead, you wait for the price to move back inside the range, which serves as your confirmation that the sweep was a fake-out.
-
The Volume Filter: A valid sweep is usually accompanied by a spike in volume during the wick. This represents the high amount of stop-losses being triggered.
-
The Timeframe Logic: These deviations are often more reliable on the 1-hour, 4-hour, or daily timeframes. On the 1-minute chart, you are just dealing with noise.
-
Risk Management: Your stop-loss should be placed just below the wick low of the sweep itself. If the price returns to the sweep low, the institutional thesis is invalidated.
Avoiding the “Breakdown” Trap
Not every dip below a range low is a sweep; some are indeed breakdowns. How do you tell the difference? A breakdown often sees a sustained move below the support with lower volume, signaling a lack of institutional interest in defending the zone. A sweep, by contrast, is characterized by a violent rejection of the price level.
Expert Insight: When in doubt, look for “confluence.” If the range low deviation also aligns with a historical Fibonacci level or a psychological round number (like $50,000 for BTC), the probability of a successful reversal increases significantly. I always prioritize sweeps that occur at “obvious” support zones that everyone else is looking at, as these hold the most liquidity.
Trading liquidity sweeps is about shifting your perspective from “following the trend” to “tracking the liquidity.” By identifying where the stops are clustered and waiting for the inevitable sweep, you can position yourself alongside the smart money rather than acting as their exit liquidity. Start practicing patience, wait for the range recapture, and watch your win rate climb as you stop trading the “break” and start trading the “deviation.”
FAQ
Can I trade liquidity sweeps on all crypto assets?
Stick to high-volume, liquid assets like Bitcoin and Ethereum. Low-cap alts often break support and never look back because there is no institutional interest to defend those zones.
What if the price doesn’t reverse?
That is why we have a stop-loss. If the price reclaims the range but then falls back through the support, the sweep failed. Close the position and accept the loss.
Do I need a specific indicator for this?
No, you only need clean charts, visible range highs/lows, and volume. Indicators often just obscure the pure price action that defines a sweep.
Is this better for day trading or swing trading?
This is a versatile strategy. It works beautifully on 1-hour charts for intraday setups and equally well on daily charts for identifying major swing bottoms.