Most crypto traders can recall their big wins in detail yet struggle to explain why the losing trades happened. Without a clear record, the same mistakes repeat and progress stays slow.
A well-structured trading journal turns random results into usable information. Tracking the right metrics reveals what actually drives your profitability and what quietly drains it. Here are five essential metrics every serious crypto trader should record and review.
Metric 1: Risk-Reward Ratio on Every Trade
Record the planned risk-reward ratio before entry and the realized ratio after exit. Planned risk-reward shows whether your setups offer enough potential upside relative to the stop distance. Realized risk-reward reveals how well you execute that plan.
Many traders discover they frequently accept 1:1 or worse rewards while aiming for higher numbers. Others find they cut winners too early, turning strong theoretical ratios into mediocre results. Logging both numbers forces honesty about setup quality and trade management.
Review this metric weekly. Look for patterns by market condition or setup type. Improving average realized risk-reward often produces larger gains than simply increasing win rate.
Metric 2: Win Rate and Its Context
Win rate alone misleads. A 60% win rate with poor risk-reward can still lose money. A 40% win rate with strong risk-reward can be highly profitable. Always track win rate alongside average win size and average loss size.
Break the data down further. Calculate win rate for different pairs, timeframes, and setup types. You may find one strategy performs well in trending markets while another only works in ranges. This context prevents you from abandoning a solid approach during a normal drawdown.
Track the metric over meaningful sample sizes. Twenty trades tell you little. A hundred trades across varying conditions begin to show real tendencies.
Metric 3: Maximum Drawdown and Recovery Time
Maximum drawdown measures the largest peak-to-trough decline in your account. Recovery time tracks how long it takes to reach a new equity high afterward. These two numbers reveal the emotional and practical cost of your trading style.
Some strategies produce frequent small losses and shallow drawdowns. Others deliver larger wins but deeper and longer drawdowns. Knowing your typical drawdown profile helps you set realistic expectations and avoid panic during inevitable losing streaks.
Record drawdown both in percentage and absolute terms. Also note whether the drawdown came from a series of small losses or a few oversized ones. The cause matters more than the number itself.
Metric 4: Average Holding Time and Time-Based Performance
Log how long each trade stays open. Then examine performance by holding-time buckets—scalps under an hour, intraday trades, multi-day swings. Many traders discover they perform far better in one duration than others.
Holding time also interacts with fees and funding rates in crypto. Short trades can lose edge to costs if not managed tightly. Longer trades face overnight risk and funding payments. Tracking the data shows whether your average hold time supports or undermines profitability.
Review this metric when you change strategies or timeframes. A mismatch between intended style and actual holding behavior often explains inconsistent results.
Metric 5: Emotional and Process Notes

Numbers alone miss critical information. After each trade, write a short note on your emotional state, whether you followed the plan, and any external distractions. Over time these notes reveal behavioral patterns that pure statistics cannot show.
Common discoveries include trading larger after losses, forcing setups when bored, or abandoning stops during high-volatility events. Once the pattern is visible, you can create specific rules to counteract it.
Keep the notes brief but honest. A single sentence is often enough. The goal is awareness, not lengthy journaling that becomes a chore.
FAQ
How many trades should I log before reviewing metrics?
Aim for at least 30–50 trades before drawing firm conclusions. Smaller samples often mislead.
Should I track every small scalp?
Yes if scalping is part of your strategy. Consistency in logging prevents selective memory.
What is a good risk-reward ratio to target?
Many discretionary traders aim for at least 1:1.5 or 1:2 on average. The key is that realized ratios stay close to planned ones.
How often should I review my journal?
Weekly reviews work well for most active traders. Monthly deeper analysis helps identify longer-term trends.
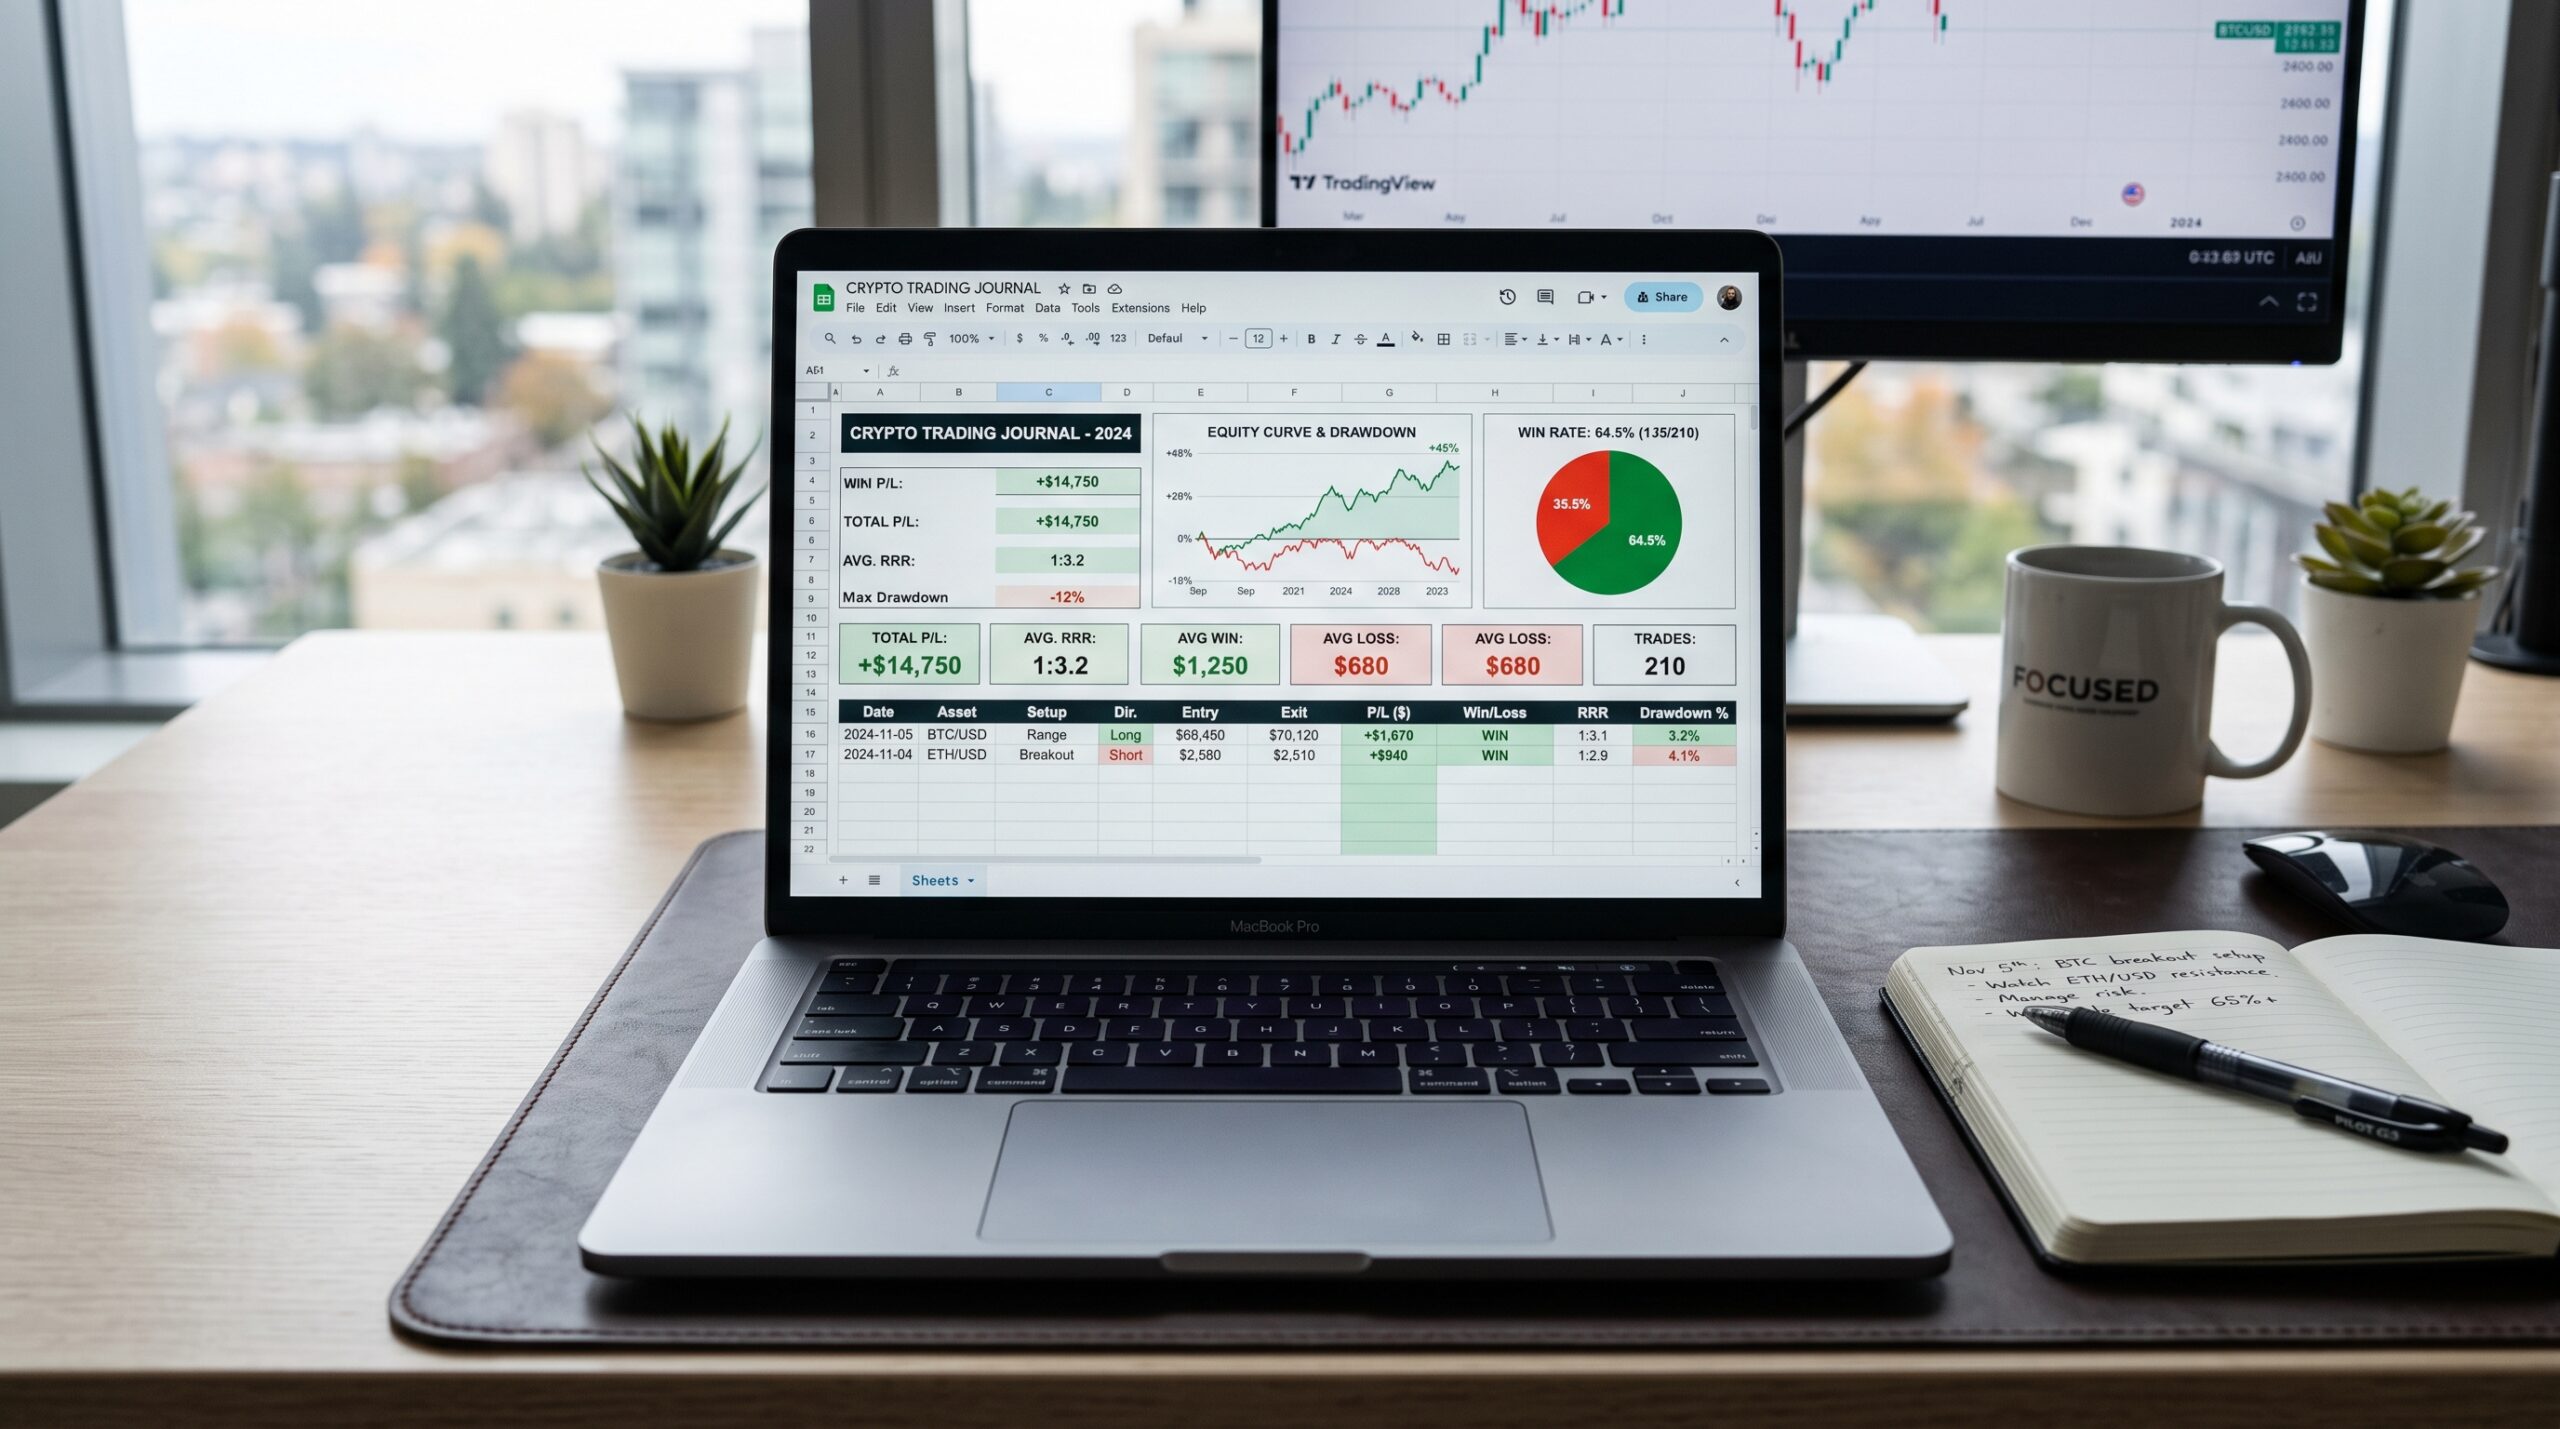
Can a simple spreadsheet work as a journal?
Yes. Many effective journals start as basic spreadsheets. The discipline of recording matters more than fancy software.
Turn Data Into Better Decisions
An effective crypto trading journal focuses on metrics that directly influence profitability: risk-reward, win rate with context, drawdown behavior, holding time, and honest process notes. Tracking these five areas reveals both the strengths and the leaks in your trading.
Start recording every trade this week. Review the data regularly and adjust one variable at a time. The traders who improve steadily are usually the ones who measure their performance clearly and act on what the numbers show. Build the journal, protect the data, and let the feedback guide your next steps.