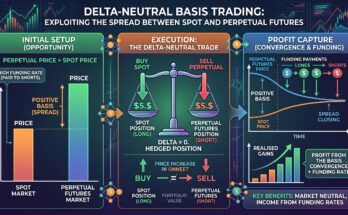
You have likely spent hours staring at a chart, waiting for the “big move,” only to be caught completely off guard when the market suddenly swings 20% in a few minutes. We have all been there. Most traders focus entirely on predicting price direction, but the real money—and the real risk—is often hidden in the volatility. If you are still using basic moving averages to gauge market heat, you are missing the most critical layer of the crypto market: volatility clustering.
This is where GARCH (Generalized Autoregressive Conditional Heteroskedasticity) models come into play. They aren’t just academic math; they are the underlying logic that institutional algorithms use to measure “risk regimes.” By learning how to use these models, you shift from guessing when the market will move to understanding the statistical probability of a high-volatility event.
Why Standard Indicators Fail Crypto
Traditional indicators often assume that volatility is constant or that it changes slowly. In the world of crypto, that assumption is a recipe for liquidation. Crypto exhibits “volatility clustering,” meaning that periods of high volatility tend to be followed by more high volatility, and quiet periods tend to be followed by more quiet.
Expert Insight: When the market is calm, your standard indicators will tell you to “range trade.” But if a GARCH model detects that the conditional variance is starting to spike, it’s signaling that the “regime” is shifting. You don’t want to be caught in a range-bound strategy when the market is preparing for a breakout. GARCH helps you “see” that shift before the actual price expansion occurs.
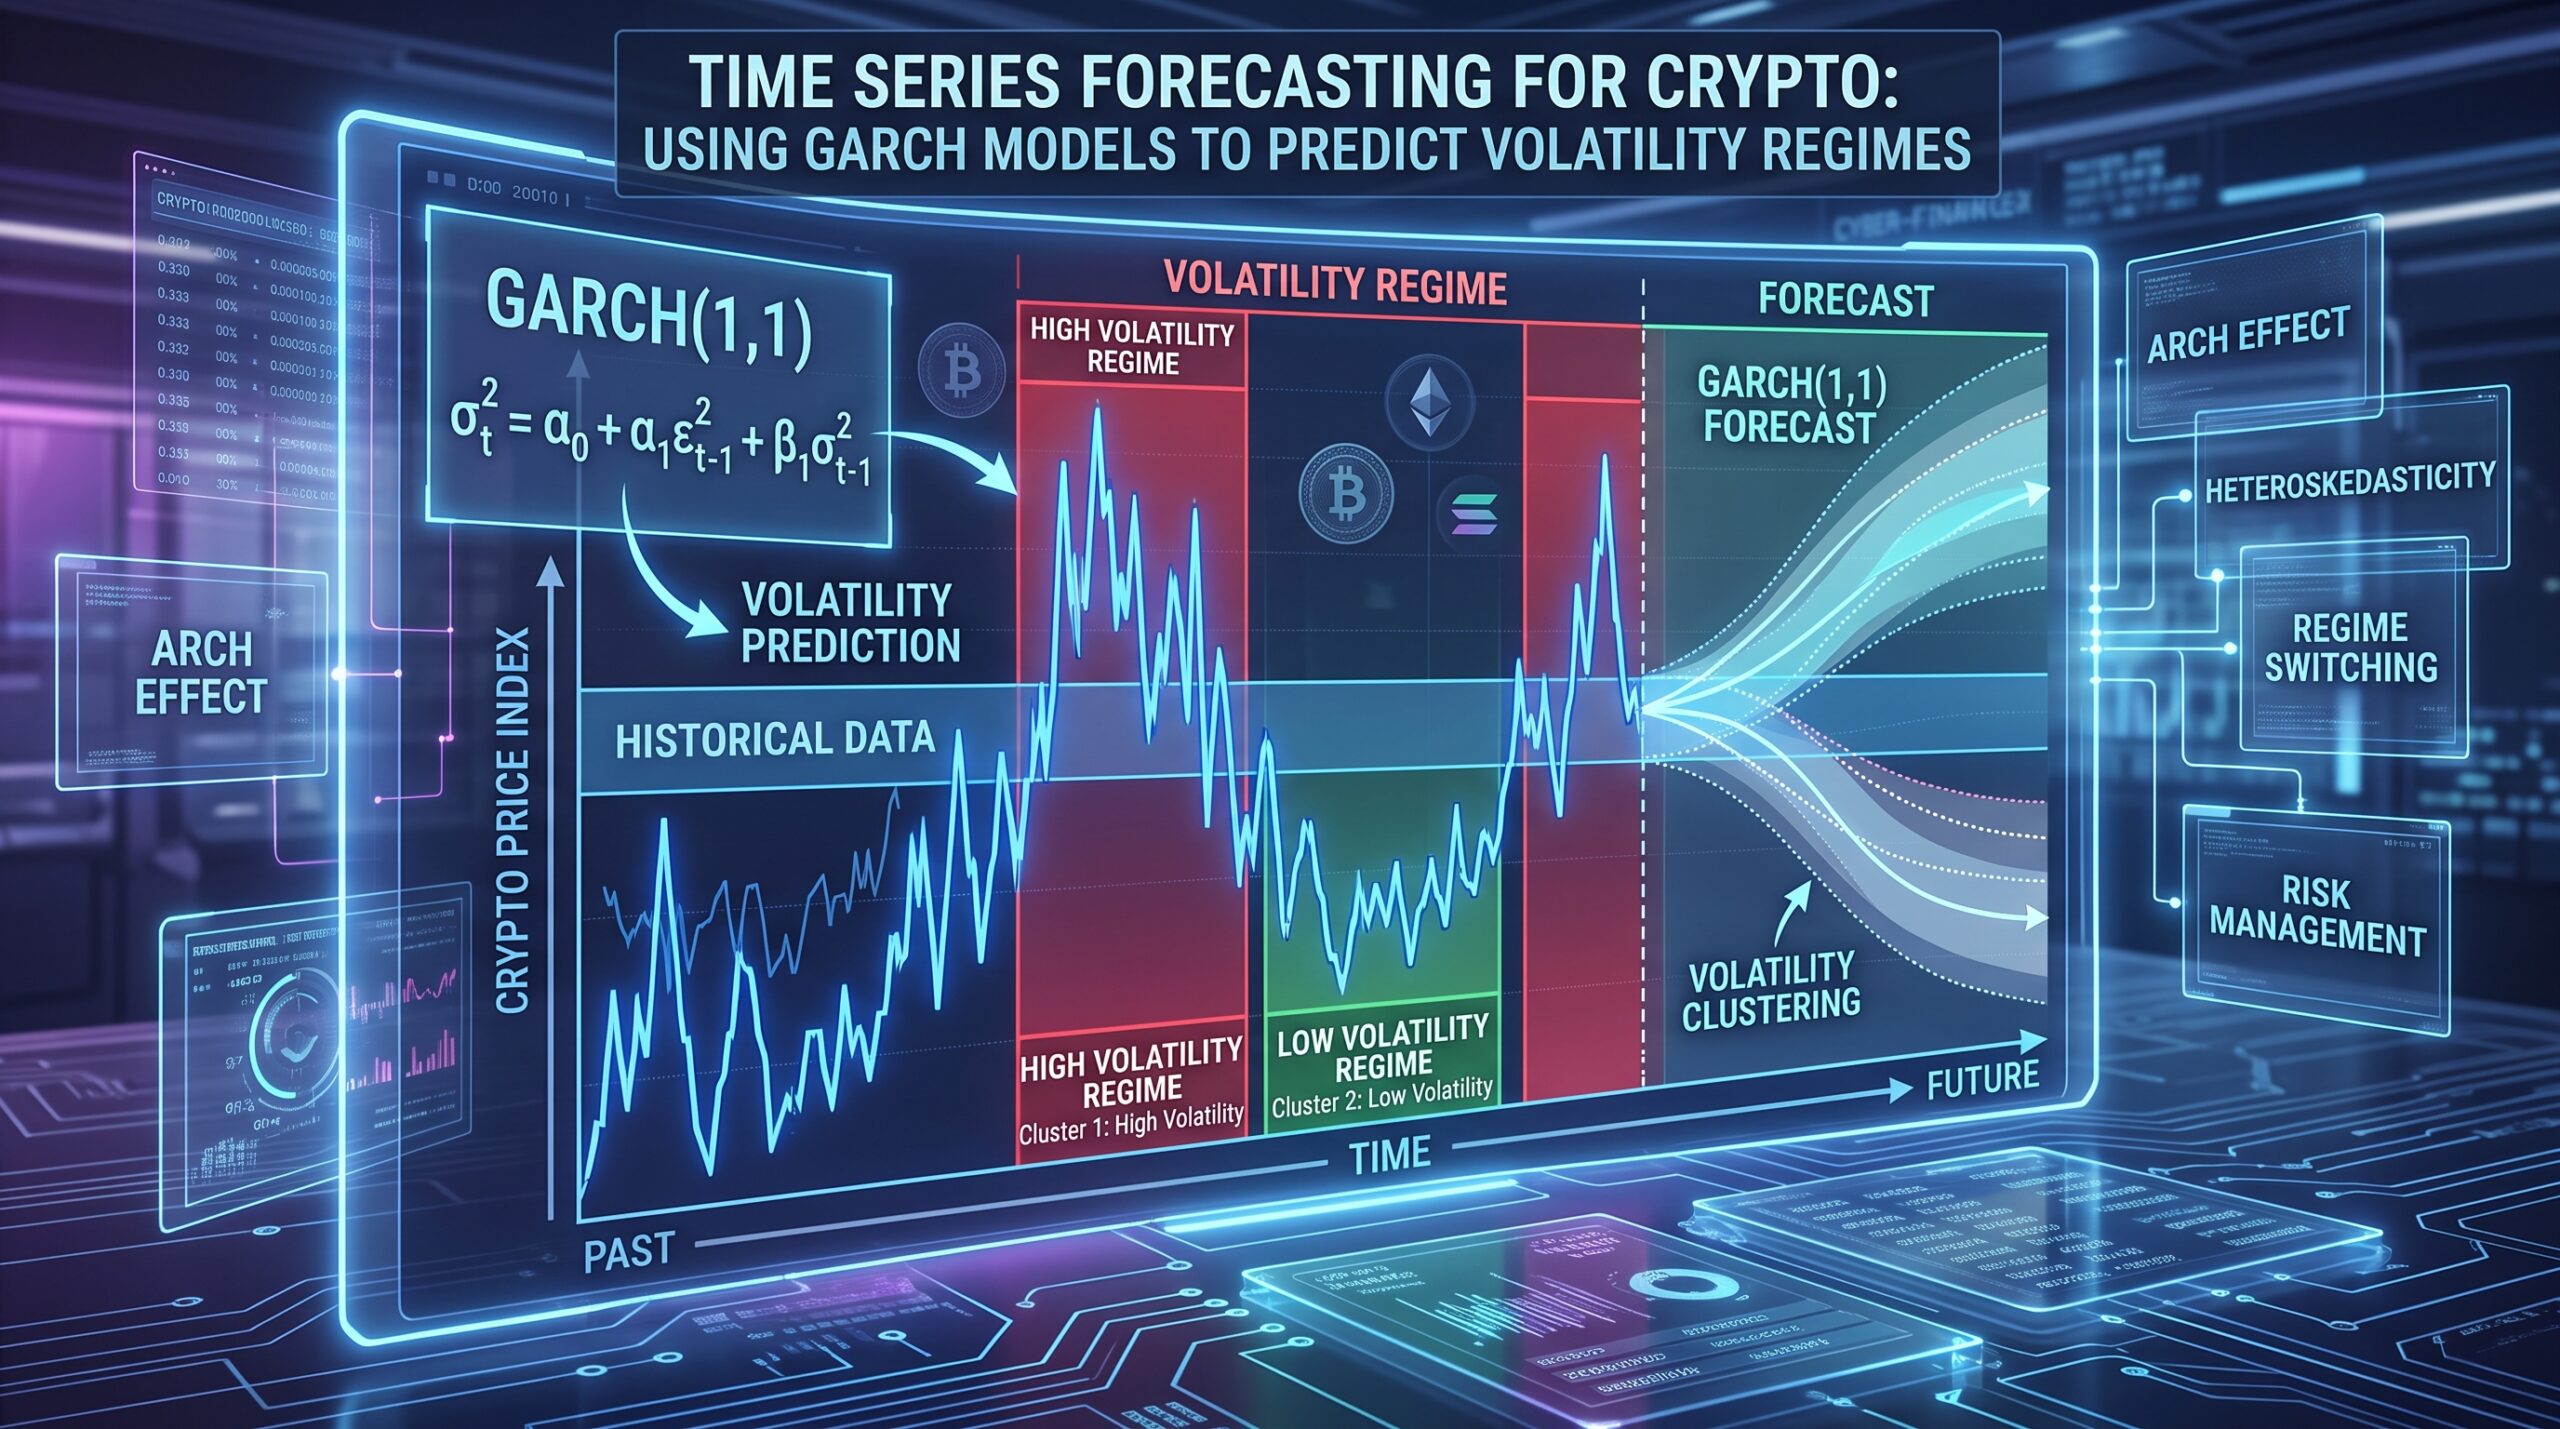
The GARCH(1,1) Framework: Your Volatility Baseline
The GARCH(1,1) model is the industry benchmark. It uses two key components: the “ARCH” term, which reacts to recent market shocks (yesterday’s moves), and the “GARCH” term, which accounts for the persistence of volatility (the long-term memory of the market).
Personal Example: I used to think that a “volatile” day was just a one-off event. After I started applying GARCH(1,1) to my data, I realized that a single high-volatility day was actually the beginning of a 5-day “high-volatility regime.” I stopped trying to trade the next day as if it would be normal; I switched my sizing to be much smaller to account for the heightened risk. That one change saved me more money than any entry strategy ever did.
Advanced Models: Beyond the Standard GARCH
While GARCH(1,1) is a great start, the crypto market is “asymmetric.” Bad news (a crash) usually spikes volatility much faster than good news (a rally). For this, pros use variants like GJR-GARCH or EGARCH.
Expert Insight: These models are built specifically to account for leverage effects—the tendency for volatility to jump more when prices fall. If you aren’t using an asymmetric model, your risk management system is likely underestimating the danger of a sudden market dump.
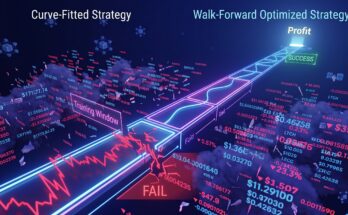
Avoiding the “Overfitting” Trap
It is incredibly tempting to try to build the “perfect” model that predicts every single tick. Don’t do it. If you add too many parameters to your GARCH model, you will “overfit” the data, meaning your model will look amazing on past charts but fail the moment you use it in the live market.
Expert Insight: Stick to parsimonious structures. A simple GARCH model that is robust and stable is vastly superior to a complex, multi-parameter model that breaks under the pressure of real-time trading. Your goal isn’t to be “right” about the exact volatility percentage; it’s to be “right” about the current regime.
Forecasting volatility with GARCH models is about giving yourself a roadmap for risk. When you understand that the market is entering a high-volatility regime, you adjust your leverage, widen your stops, and wait for the “noise” to settle. Stop trying to predict every move and start managing the regime you’re in. The math is complex, but the benefit is simple: survival.
FAQ
Can I run GARCH models on 1-minute data?
Technically, yes, but it is noisy. GARCH models work best on higher timeframes like the 4-hour or Daily where the “volatility clustering” signal is much clearer and less prone to random exchange-level blips.
Do GARCH models predict price direction?
No, they predict volatility. Knowing that volatility is about to spike tells you that a big move is coming, but it won’t tell you if that move is up or down. You must pair GARCH with your directional strategy.
How do I know if my GARCH model is “working”?
Backtest your model against your historical stop-loss hit rates. If your model correctly identifies high-volatility regimes and you are able to reduce your position size during those times, your hit rate should improve significantly.
What software do I need to use these?
You don’t need a supercomputer. You can implement basic GARCH models in Python using libraries like arch or statsmodels. There are plenty of open-source scripts that can help you get started with your own data.